Headline Cards
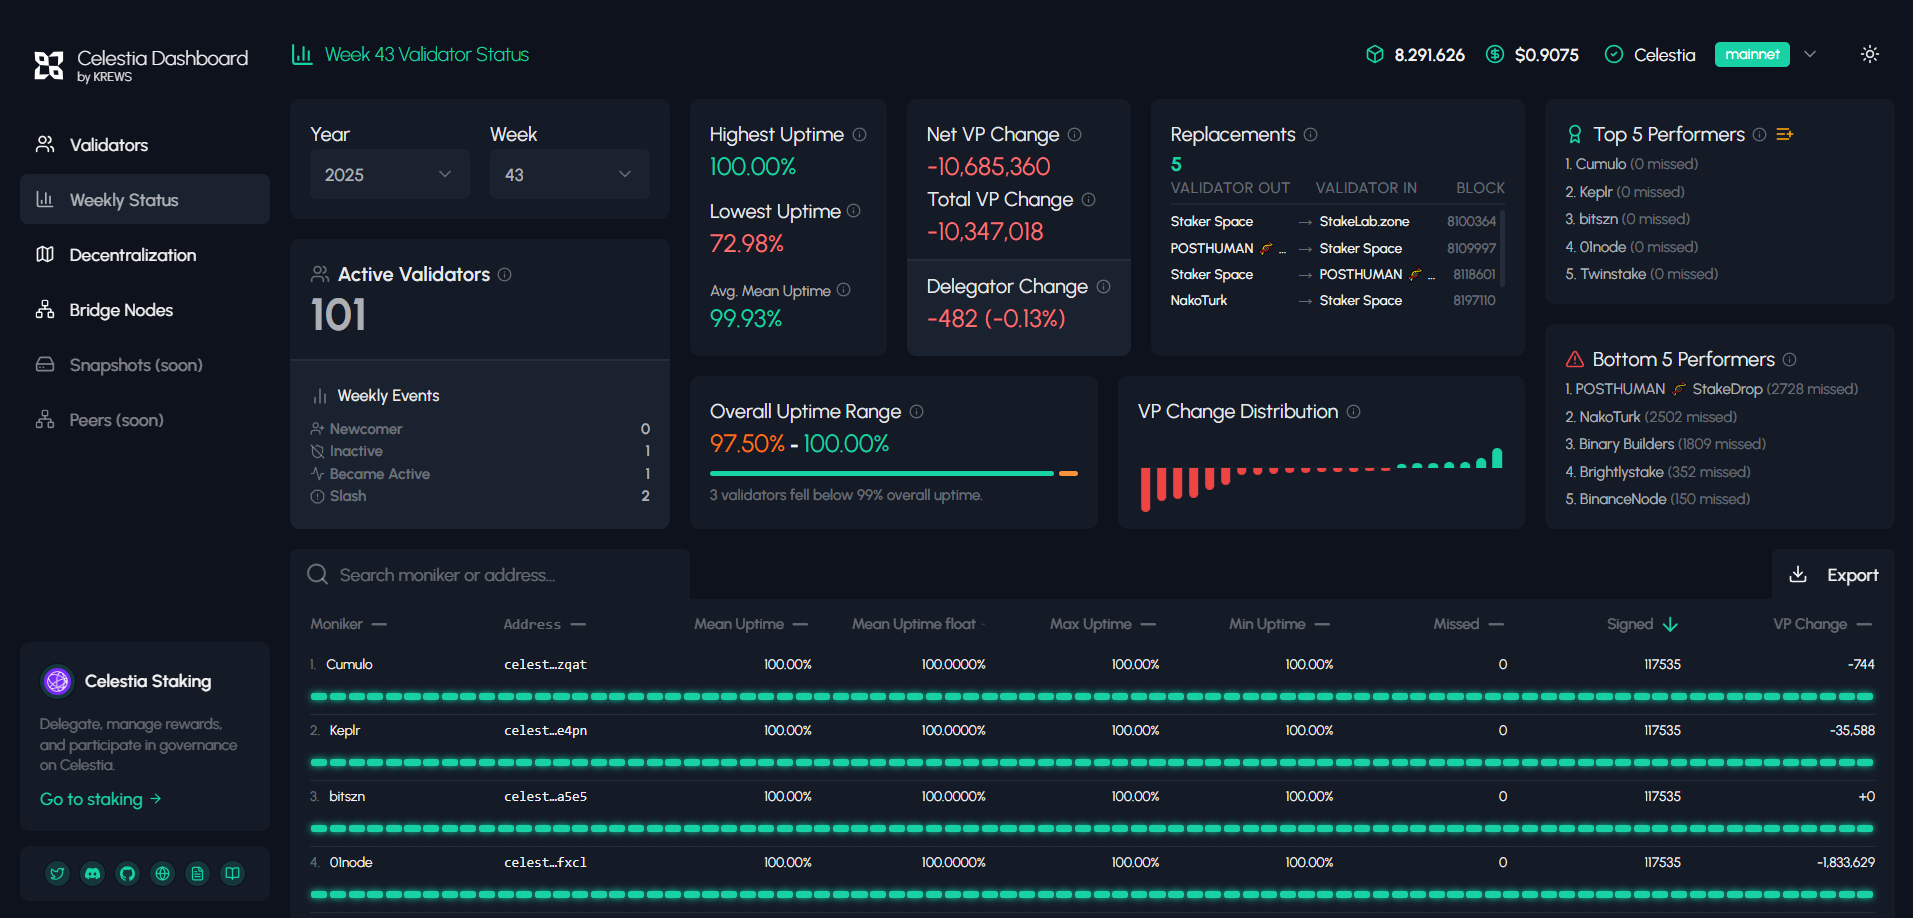
- Active Validators — Validators observed as active during the selected week.
- Highest / Lowest Uptime — Best and worst weekly uptime among validators.
- Avg. Mean Uptime — Average of validators’ mean uptime during the week.
- Net VP Change — Sum of positive minus negative Voting Power changes across validators for the week.
- Total VP Change — Aggregate absolute VP movement (adds both increases and decreases).
- Delegator Change — Net change in the number of delegator accounts.
- Replacements — Count of operators that entered or exited the active set.
Rankings
- Top 5 Performers — Validators with minimal misses and highest mean uptime.
- Bottom 5 Performers — Validators with elevated misses or low uptime.
- Overall Uptime Range — Distribution of weekly uptime (min–max bands).
- VP Change Distribution — Histogram showing stake shifts across operators.
Table Columns
- Moniker / Address
- Mean Uptime (percentage) and Mean Uptime (float) (exact decimal, e.g., 99.3650%)
- Max / Min Uptime
- Missed — Count of missed blocks/proposals for the week (network‑specific logic)
- Signed — Signed block count
- VP Change — Voting Power change in the week
How metrics are computed
- Mean Uptime: Average signing participation over all relevant blocks in the week for a validator.
- Missed / Signed: Derived from per‑block signatures; chain clients can expose this via RPC or indexers.
- VP Change: Computed from week‑start vs week‑end stake snapshots per validator.
How to read the page
- Look at Avg. Mean Uptime to understand overall network health.
- Use Top/Bottom 5 to spot outliers and potential incidents.
- Cross‑reference VP Change Distribution with Delegator Change to see if stake movement is retail‑ or whale‑driven.